Test Item
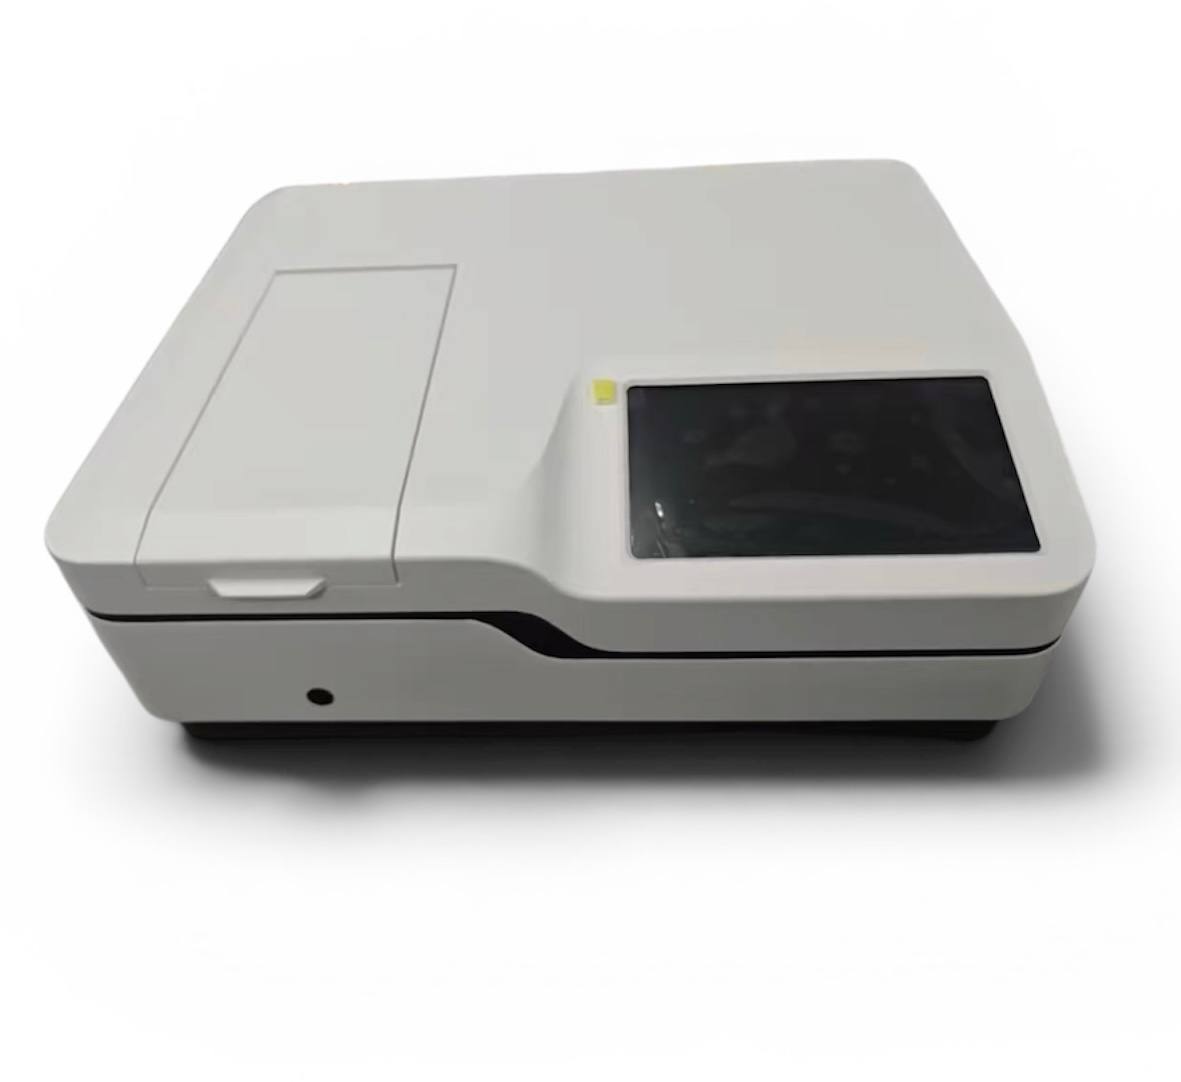
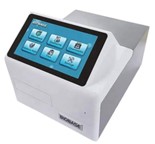
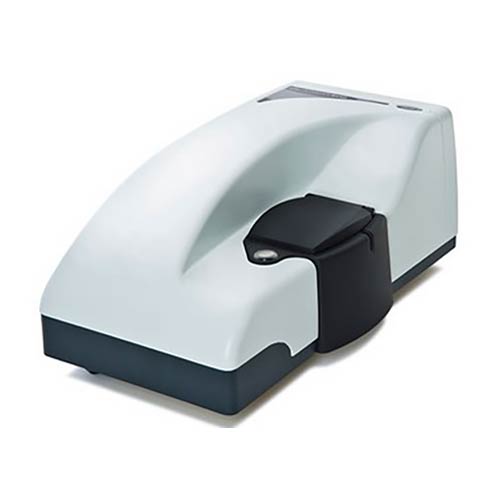
UV–Visible and Diffuse Reflectance Spectrophotometer-Biobase China
10000.00 IQD- Category : Tests
- Group : Nanotechnology Tests
Phi Nanoscience Center (PNSC)
The BIOBASE UV–Visible spectrophotometer is a versatile analytical instrument designed for accurate measurement of the absorption, transmission, and reflection properties of liquid and solid materials across the ultraviolet and visible spectral regions.
In addition to conventional UV–Visible analysis of solutions, the instrument can be equipped with a Diffuse Reflectance Spectroscopy attachment, commonly known as DRS, for the characterization of powders, coatings, thin films, ceramics, pigments, catalysts, and nanomaterials.
High-Performance Optical Analysis
The double-beam optical configuration provides improved measurement stability by continuously comparing the sample beam with a reference beam.
This design helps reduce the effects of lamp-intensity fluctuations, optical drift, and changes in background conditions, resulting in reliable and reproducible spectra.
The instrument is suitable for routine laboratory analysis, scientific research, material characterization, and quantitative measurements.
UV–Visible Measurement
Conventional UV–Visible spectroscopy measures the interaction of ultraviolet and visible light with a liquid or transparent sample.
The sample absorbs specific wavelengths depending on its electronic structure, chemical composition, concentration, and molecular properties.
Main UV–Visible Applications
- Recording absorption spectra of solutions.
- Determining the wavelength of maximum absorption, λmax.
- Measuring the concentration of chemical compounds.
- Preparing calibration curves.
- Monitoring reaction kinetics.
- Studying photocatalytic degradation.
- Measuring dye and pollutant concentrations.
- Characterizing metal nanoparticles and nanocomposites.
- Studying optical transitions and electronic absorption.
- Evaluating drug-release profiles.
- Quantifying proteins, DNA, and other biomolecules.
- Monitoring changes in absorbance over time.
- Comparing treated and untreated samples.
Diffuse Reflectance Spectroscopy
Diffuse Reflectance Spectroscopy is used mainly for solid, opaque, powdered, or highly scattering samples that cannot be measured easily using conventional transmission-mode UV–Visible spectroscopy.
During DRS analysis, light is directed onto the sample surface. Part of the light is absorbed, while the remaining light is scattered and reflected in different directions.
An integrating sphere or diffuse-reflectance accessory collects the reflected light and records the reflectance spectrum.
Materials Suitable for DRS Analysis
- Nanopowders.
- Semiconductor materials.
- Metal oxides.
- Photocatalysts.
- Pigments.
- Ceramics.
- Polymers.
- Composite materials.
- Thin films.
- Coatings.
- Catalysts.
- Pharmaceutical powders.
- Geological and mineral samples.
Main Measurement Modes
Depending on the installed instrument configuration and software, the system may support several measurement modes.
Photometric Mode
Measures absorbance or transmittance at one or more selected wavelengths.
It is suitable for:
- Routine concentration measurements.
- Quality-control testing.
- Comparing sample absorbance.
- Monitoring specific compounds.
Spectrum Mode
Records the complete UV–Visible spectrum over a selected wavelength range.
It is used for:
- Determining λmax.
- Identifying absorption bands.
- Comparing optical properties.
- Studying nanoparticle formation.
- Evaluating electronic transitions.
Quantitative Analysis
Determines sample concentration using a calibration curve prepared from known standard concentrations.
The calibration relationship is commonly based on the Beer–Lambert law:
[
A = \varepsilon b c
]
Where:
- (A) is the absorbance.
- (\varepsilon) is the molar absorptivity.
- (b) is the optical path length.
- (c) is the concentration.
Kinetic and Time-Scan Measurements
Records absorbance changes at a selected wavelength as a function of time.
This mode is useful for:
- Reaction-rate studies.
- Enzyme kinetics.
- Nanoparticle synthesis monitoring.
- Photocatalytic degradation.
- Stability studies.
- Drug-release experiments.
Diffuse Reflectance Mode
Measures the percentage of reflected light from solid and powdered samples.
DRS data may be used to evaluate:
- Reflectance behavior.
- Optical absorption edge.
- Band-gap energy.
- Surface optical properties.
- Color and pigment behavior.
- Semiconductor photoactivity.
Optical Band-Gap Determination
Diffuse-reflectance data are frequently used to estimate the optical band gap of semiconductor materials.
The reflectance spectrum is commonly converted using the Kubelka–Munk function:
[
F(R) = \frac{(1-R)^2}{2R}
]
Where:
- (R) is the measured diffuse reflectance.
- (F(R)) is the Kubelka–Munk function.
The optical band gap may then be estimated using a Tauc relationship:
[
[F(R)h\nu]^n = A(h\nu-E_g)
]
Where:
- (h\nu) is the photon energy.
- (E_g) is the optical band-gap energy.
- (A) is a proportionality constant.
- (n) depends on the type of electronic transition.
Commonly used forms include:
- (n = 2) for a direct allowed transition.
- (n = \frac{1}{2}) for an indirect allowed transition.
The correct transition model should be selected according to the electronic properties and published literature for the studied material.
Key Instrument Features
- Double-beam optical design.
- Stable absorbance and transmittance measurements.
- UV and visible spectral scanning.
- High measurement repeatability.
- Low optical noise.
- Digital wavelength selection.
- Automatic baseline correction.
- Spectrum storage and comparison.
- Quantitative calibration-curve analysis.
- Kinetic and time-course measurements.
- Computer-controlled data acquisition.
- User-friendly operating software.
- Export of spectra and numerical data.
- Compatibility with liquid cuvettes.
- Diffuse-reflectance capability for solid materials.
- Suitable for routine testing and scientific research.
Exact wavelength range, bandwidth, wavelength accuracy, scanning speed, and photometric range depend on the specific BIOBASE instrument model and installed accessories.
Information Provided in the Analysis Report
For UV–Visible Measurements
- Absorbance spectrum.
- Transmittance spectrum, when requested.
- Wavelength range.
- Wavelength of maximum absorption.
- Absorbance values at selected wavelengths.
- Sample concentration, when calibration standards are provided.
- Calibration curve and regression equation.
- Correlation coefficient.
- Time-dependent absorbance data.
- Comparison between samples.
- Digital spectral files.
- Brief interpretation of the main absorption features.
For DRS Measurements
- Diffuse-reflectance spectrum.
- Percentage reflectance versus wavelength.
- Kubelka–Munk-transformed spectrum, when requested.
- Optical absorption edge.
- Tauc plot.
- Estimated optical band-gap value.
- Comparison between untreated and modified samples.
- Discussion of reflectance and absorption behavior.
- Digital data suitable for Origin, Excel, or other analysis software.
Sample Preparation Guide
Liquid Samples
- Samples should be homogeneous and free from large suspended particles unless turbidity is part of the study.
- Transparent quartz cuvettes are generally required for ultraviolet measurements.
- Glass or plastic cuvettes may be suitable only for selected visible-region measurements.
- The sample should be diluted when absorbance exceeds the reliable measurement range.
- A suitable solvent blank must be provided.
- Cuvettes must be clean and free from scratches, fingerprints, and bubbles.
Nanoparticle Suspensions
- The suspension should be dispersed thoroughly before measurement.
- Sonication may be used when appropriate.
- Measurements should be performed shortly after dispersion when the suspension is unstable.
- Excessive sedimentation or agglomeration may affect the spectrum.
- A matching solvent or dispersion medium should be used as the blank.
Powder Samples for DRS
- The powder should be dry and homogeneous.
- The sample holder should be filled evenly.
- The powder surface should be flat and uniformly packed.
- Avoid excessive compression that may change the reflectance behavior.
- The sample should cover the measurement opening completely.
- A sufficient quantity should be provided to form an opaque layer.
Thin Films and Coatings
- The coating should be uniform and securely attached to the substrate.
- The substrate type must be reported.
- Blank-substrate measurements may be required.
- The surface should be clean and free from fingerprints.
- Film thickness should be provided when available.
Solid Pellets
- The pellet should be flat, intact, and large enough to cover the measurement area.
- Surface cracks and roughness should be minimized when they are not part of the study.
- The pellet thickness should be sufficient to prevent light transmission when diffuse-reflectance analysis is intended.
Important Sample Notes
- Highly concentrated samples should be diluted before UV–Visible analysis.
- Turbid samples may produce scattering that increases the apparent absorbance.
- Agglomerated nanoparticles may cause baseline distortion.
- Fluorescent samples may require special interpretation.
- Highly reflective, dark, or strongly absorbing powders may require adjusted measurement settings.
- Sample preparation conditions should remain identical when comparing multiple samples.
- DRS measurements should be performed using the same packing method and sample thickness for all samples.
- The sample code, composition, solvent, concentration, and preparation method should be provided.
Understanding UV–Visible Results
Absorption Peak
An absorption peak represents a wavelength region where the sample strongly absorbs light.
The peak position may be related to:
- Electronic transitions.
- Molecular structure.
- Nanoparticle size.
- Particle shape.
- Surface plasmon resonance.
- Chemical interactions.
- Aggregation.
- Complex formation.
Peak Shift
A shift toward a longer wavelength is called a red shift.
A shift toward a shorter wavelength is called a blue shift.
Such shifts may indicate:
- Changes in particle size.
- Changes in surface chemistry.
- Solvent effects.
- Aggregation.
- Interaction between different materials.
- Changes in electronic structure.
Peak Intensity
An increase or decrease in absorbance may be related to:
- Sample concentration.
- Reaction progress.
- Nanoparticle formation.
- Pollutant degradation.
- Dissolution.
- Release of an active compound.
- Changes in optical density.
Understanding DRS Results
High Reflectance
High reflectance means that a large fraction of incident light is reflected from the material.
This may be associated with:
- Light-colored materials.
- Low absorption.
- Wide-band-gap materials.
- Highly scattering powders.
Low Reflectance
Low reflectance indicates stronger light absorption.
This may be associated with:
- Dark materials.
- Narrow-band-gap semiconductors.
- Strong electronic transitions.
- Carbon-containing composites.
- Metal or defect-state absorption.
Absorption Edge
The absorption edge is the wavelength region where the material begins to absorb light strongly.
A shift of the absorption edge toward longer wavelengths generally indicates absorption of lower-energy photons and may correspond to a reduced optical band gap.
Band-Gap Comparison
Changes in the estimated band gap after doping, composite formation, annealing, or surface modification may indicate changes in:
- Electronic structure.
- Defect levels.
- Crystal structure.
- Particle size.
- Interfacial interactions.
- Phase composition.
Band-gap interpretation should be supported by complementary techniques such as XRD, FTIR, SEM, TEM, or XPS.
Common Applications
Nanotechnology and Advanced Materials
- Optical characterization of nanoparticles.
- Surface plasmon resonance analysis.
- Semiconductor band-gap estimation.
- Nanocomposite characterization.
- Monitoring nanoparticle synthesis.
- Comparing doped and undoped materials.
Photocatalysis
- Monitoring dye degradation.
- Measuring pollutant concentration.
- Studying photocatalytic reaction kinetics.
- Evaluating semiconductor absorption edges.
- Estimating optical band gaps.
- Comparing visible-light absorption.
Pharmaceuticals and Life Sciences
- Drug concentration measurement.
- Dissolution and release studies.
- DNA and protein quantification.
- Stability studies.
- Enzyme-reaction monitoring.
- Pharmaceutical quality control.
Environmental Analysis
- Water-pollutant measurement.
- Heavy-metal complex analysis.
- Dye concentration determination.
- Monitoring treatment processes.
- Quantifying organic contaminants.
Food and Beverage Analysis
- Color measurement.
- Additive analysis.
- Antioxidant studies.
- Ingredient quantification.
- Quality and safety testing.
Coatings and Pigments
- Reflectance characterization.
- Color and optical-property comparison.
- UV-blocking evaluation.
- Protective-coating analysis.
- Pigment-performance assessment.
Limitations
- Conventional UV–Visible measurements require transparent or suitably diluted samples.
- Turbidity and particle scattering may interfere with absorbance readings.
- UV–Visible spectroscopy alone does not provide complete chemical identification.
- Overlapping absorption bands may make peak interpretation difficult.
- Accurate concentration measurement requires suitable standards and calibration.
- Very high absorbance values may be outside the reliable instrument range.
- DRS band-gap calculations depend strongly on the selected mathematical model.
- Surface roughness and powder packing can affect DRS results.
- DRS does not directly determine particle size or crystal structure.
- The estimated optical band gap should not be interpreted without considering the material’s transition type.
- Fluorescence, scattering, or sample instability may affect the recorded spectrum.
Frequently Asked Questions
What is the difference between UV–Visible spectroscopy and DRS?
UV–Visible spectroscopy is generally used for transparent liquids or films and measures transmitted light.
DRS is mainly used for opaque solids and powders and measures diffusely reflected light.
Can nanoparticles be analyzed?
Yes. Nanoparticles can be measured as liquid suspensions using conventional UV–Visible spectroscopy or as dry powders using DRS.
Can the optical band gap be calculated?
Yes. The band gap may be estimated from diffuse-reflectance data using Kubelka–Munk transformation and Tauc-plot analysis.
Can liquid samples be used for DRS?
DRS is mainly intended for solid and powdered samples. Liquid samples are normally analyzed using absorbance or transmittance mode.
Can powder be measured directly?
Yes. Dry powder can be placed in a suitable DRS sample holder and measured without dissolving it.
Can coating samples be analyzed?
Yes. Coatings and thin films can be analyzed when they are uniform and compatible with the instrument accessory.
Can concentration be measured?
Yes. A calibration curve prepared from known standards is required for accurate quantitative analysis.
Can photocatalytic degradation be monitored?
Yes. The decrease in pollutant or dye absorbance can be recorded at different reaction times.
How much liquid sample is needed?
A few millilitres are normally sufficient, depending on the cuvette size.
How much powder is needed for DRS?
The quantity depends on the sample holder, but enough powder should be provided to completely cover the measurement area and form an opaque, uniform layer.
How long does the analysis take?
Basic UV–Visible or DRS spectral scanning may be completed within approximately 1–2 hours after receiving properly prepared samples.
Additional time may be required for calibration curves, kinetic analysis, multiple samples, band-gap calculations, or detailed data interpretation.
Recommended Complementary Analyses
UV–Visible and DRS measurements may be combined with:
- X-ray Diffraction: For crystalline-phase identification.
- Scanning Electron Microscopy: For surface morphology.
- Transmission Electron Microscopy: For nanoparticle size and internal structure.
- FTIR Spectroscopy: For functional-group analysis.
- Photoluminescence Spectroscopy: For charge-carrier recombination and emission behavior.
- Raman Spectroscopy: For vibrational and structural information.
- X-ray Photoelectron Spectroscopy: For surface chemistry and oxidation states.
- BET Analysis: For specific surface area and porosity.
- Electrochemical Analysis: For charge-transfer and redox behavior.
- Colorimetry: For detailed color-coordinate analysis.
References
- [1] Skoog, D. A., Holler, F. J., & Crouch, S. R. Principles of Instrumental Analysis. Cengage Learning.
- [2] Harris, D. C. Quantitative Chemical Analysis. W. H. Freeman.
- [3] Kubelka, P., & Munk, F. (1931). An Article on Optics of Paint Layers. Zeitschrift für Technische Physik, 12, 593–601.
- [4] Tauc, J., Grigorovici, R., & Vancu, A. (1966). Optical Properties and Electronic Structure of Amorphous Germanium. Physica Status Solidi, 15, 627–637.
- [5] ISO 13468. Plastics—Determination of the Total Luminous Transmittance of Transparent Materials.
- Internal Source: Phi Nanoscience Center provides UV–Visible absorption, quantitative analysis, kinetic measurements, diffuse-reflectance spectroscopy, and optical band-gap estimation for liquids, powders, coatings, thin films, and nanomaterials.
Request This Test
To request UV–Visible Spectroscopy, Diffuse Reflectance Spectroscopy, or any of our other analytical services, please complete the Sample Testing Request Form.