+9647832847564
Location: Iraq, Baghdad, near University of Technology, M907
Sat - Thu: 8:00 am - 7:00 pm
Home
About Us
About Us
Leadership Team
Help & FAQs
Careers
Policies
Privacy Policy
Money Back Policy
Tests & Services
Tests
Nanotechnology Tests
Proof Reading
Thesis Proofreading
Applications
Antimicrobial Applications
Physical and Chemical Applications
Anticancer Applications
Academy
Courses
Published Articles
Products
Blog Category
Contacts
Login
Register
Login
Register
Tests & Services
Test Item
Home
Tests & Services
Test Item
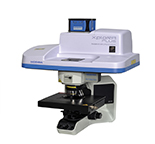
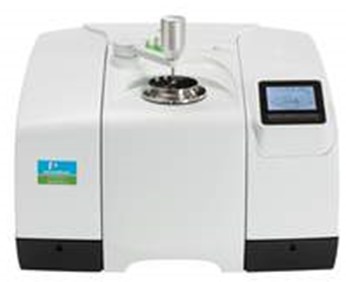
Raman Malvern HORIBA XploRA PLUS/UK
25000.00 IQD
Login to Request
Category :
Tests
Group :
Nanotechnology Tests
Details
Reviews
No reviews yet. Be the first to share your experience.
Write a Review
Submit Review
Reviews are moderated before publishing.
Related Tests
Request this test
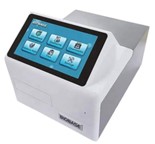
ELISA Microplate Reader
50000.00 IQD
Request this test
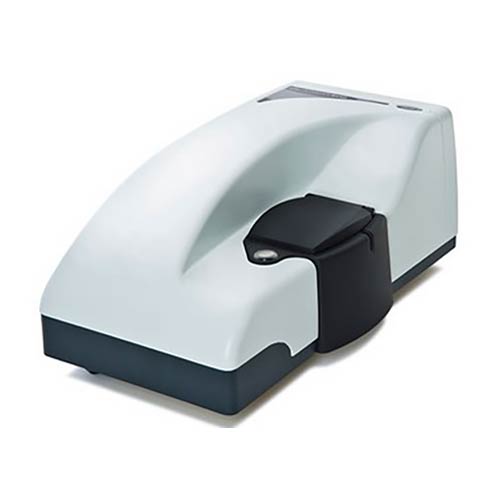
Zeta Potential-DLS
25000.00 IQD
Request this test
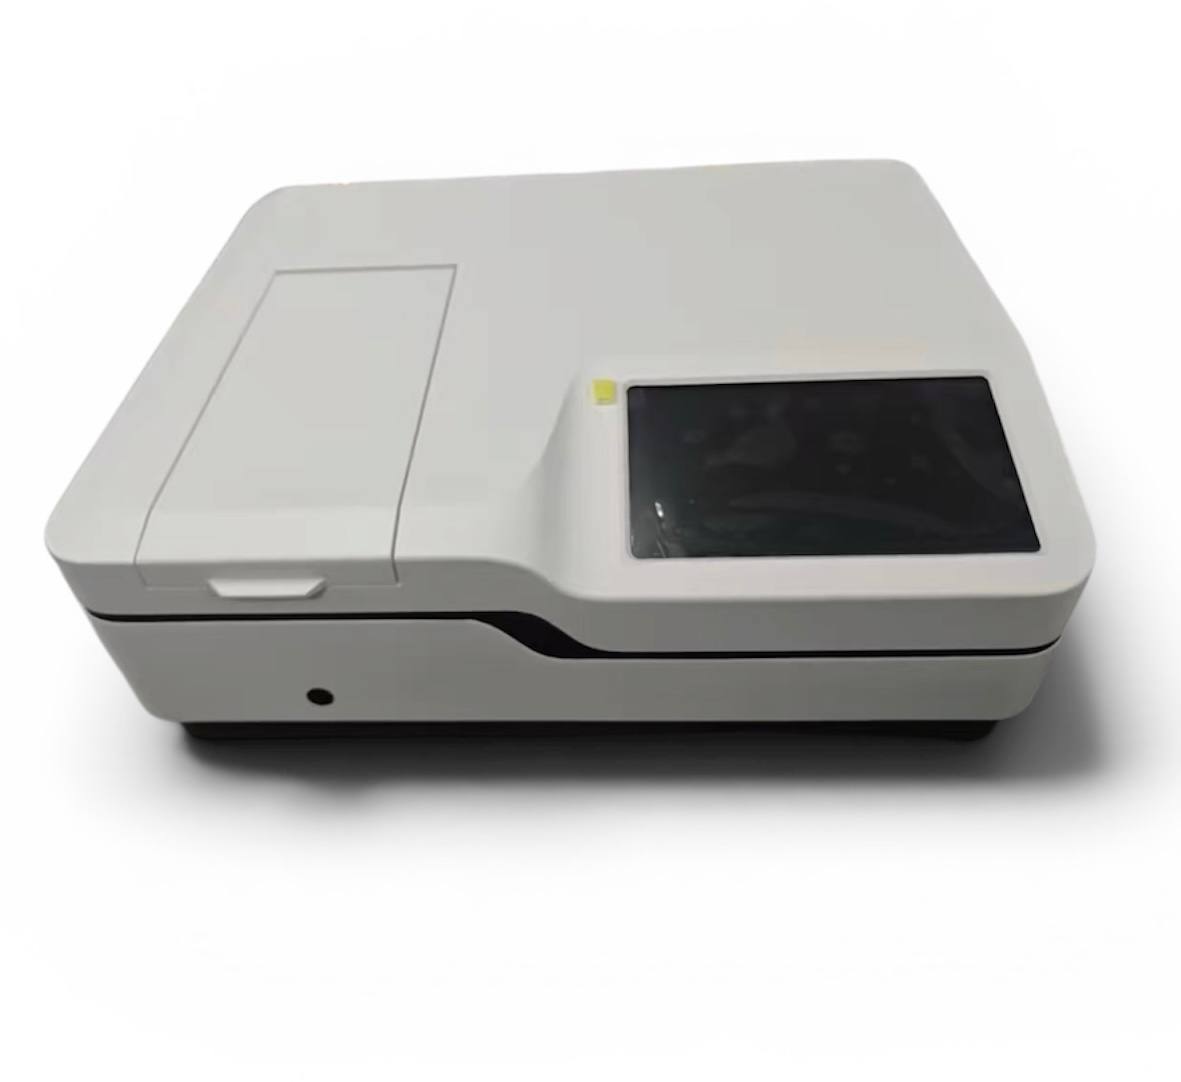
UV–Visible and Diffuse Reflectance Spectrophotometer-Biobase China
10000.00 IQD
Request this test
Fourier Transform Infrared (FTIR) Spectroscopy
15000.00 IQD